Trimaran
为了应对集群节点高负载、负载不均衡等问题,需要动态平衡各个节点之间的资源使用率,因此需要基于节点的相关监控指标,构建集群资源视图,从而为下述两种治理方向奠定实现基础:
- 方向一: 在 Pod 调度阶段,加入优先将 Pod 调度到资源实际使用率低的节点的节点Score插件
- 方向二: 在集群治理阶段,通过实时监控,在观测到节点资源率较高、节点故障、Pod 数量较多等情况时,可以自动干预,迁移节点上的一些 Pod 到利用率低的节点上
解决方式
- 针对方向一,可以通过赋予Kubernetes调度器感知集群实际负载的能力,计算资源分配和实际资源利用之间的差距,优化调度策略。
- 针对方向二,社区给出了 Descheduler 重调度方案,Descheduler 可以根据一些规则和策略配置来帮助再平衡集群状态,当前项目实现了十余种策略
scheduler-plugins基于requests调度,非常依赖request的设置。
基本概念
调度类型
重调度(Descheduling): 通常是指将部署在某个节点上调度不合理的Pod重新调度到另一个节点. 在集群利用率不均而产生热点节点、节点属性变化导致存量Pod调度规则不匹配等场景下,您可以使用重调度来优化资源使用,确保Pod在最佳节点上运行,从而保障集群的高可用性和工作负载的高效运行。
Gang scheduling(帮派调度) : 是一种调度算法,主要的原则是保证所有相关联的进程能够同时启动,防止部分进程的异常,导致整个关联进程组的阻塞. 例如,您提交一个批量 Job,这个批量 Job 包含多个任务,要么这多个任务全部调度成功,要么一个都调度不成功。 这种 All-or-Nothing 调度场景,就被称作 Gang scheduling.
拓扑感知调度: 在机器学习和大数据分析类作业中,Pod间通常有较大的网络通信需求。默认情况下,原生Kubernetes调度器会将Pod均匀打散在集群中,增加了通信距离,导致作业完成时间变长。您可以将Pod部署在同一可用区或机架上,减少通信跳数和时延以优化作业执行时间。
mu(均值) 和 sigma(标准差)
在正态分布中, mu 表示分布的中心位置,也就是平均值。
sigma 表示分布的宽度,也就是数据点偏离均值的标准距离。
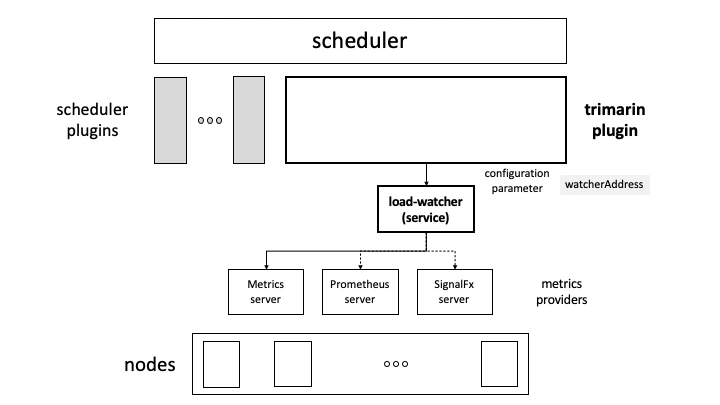
指标获取
通过 load-watcher,可以是service部署,或则直接作为客户端库嵌入.
// https://github.com/kubernetes-sigs/scheduler-plugins/blob/59a8b1ca68d0256d10239a588d69ab0ba28d4076/pkg/trimaran/collector.go
func NewCollector(logger klog.Logger, trimaranSpec *pluginConfig.TrimaranSpec) (*Collector, error) {
	if err := checkSpecs(trimaranSpec); err != nil {
		return nil, err
	}
	logger.V(4).Info("Using TrimaranSpec", "type", trimaranSpec.MetricProvider.Type,
		"address", trimaranSpec.MetricProvider.Address, "watcher", trimaranSpec.WatcherAddress)

	var client loadwatcherapi.Client
	if trimaranSpec.WatcherAddress != "" {
		// 作为service
		client, _ = loadwatcherapi.NewServiceClient(trimaranSpec.WatcherAddress)
	} else {
		// 作为库
		opts := watcher.MetricsProviderOpts{
			Name:               string(trimaranSpec.MetricProvider.Type),
			Address:            trimaranSpec.MetricProvider.Address,
			AuthToken:          trimaranSpec.MetricProvider.Token,
			InsecureSkipVerify: trimaranSpec.MetricProvider.InsecureSkipVerify,
		}
		client, _ = loadwatcherapi.NewLibraryClient(opts)
	}

	collector := &Collector{
		client: client,
	}

	// 更新本地缓存指标
	// populate metrics before returning
	err := collector.updateMetrics(logger)
	if err != nil {
		logger.Error(err, "Unable to populate metrics initially")
	}
	// start periodic updates
	go func() {
		metricsUpdaterTicker := time.NewTicker(time.Second * metricsUpdateIntervalSeconds)
		for range metricsUpdaterTicker.C {
			err = collector.updateMetrics(logger)
			if err != nil {
				logger.Error(err, "Unable to update metrics")
			}
		}
	}()
	return collector, nil
}
作为库的方式
func NewLibraryClient(opts watcher.MetricsProviderOpts) (Client, error) {
	var err error
	client := libraryClient{}
	switch opts.Name {
	case watcher.PromClientName: // prometheus 客户端的方式
		client.fetcherClient, err = metricsprovider.NewPromClient(opts)
	case watcher.SignalFxClientName:
		client.fetcherClient, err = metricsprovider.NewSignalFxClient(opts)
	default:
		client.fetcherClient, err = metricsprovider.NewMetricsServerClient()
	}
	if err != nil {
		return client, err
	}
	client.watcher = watcher.NewWatcher(client.fetcherClient)
	// 开始抓取指标
	client.watcher.StartWatching()
	return client, nil
}
获取数据
func (w *Watcher) StartWatching() {
	w.mutex.RLock()
	if w.isStarted {
		w.mutex.RUnlock()
		return
	}
	w.mutex.RUnlock()

	fetchOnce := func(duration string) {
		curWindow, metric := w.getCurrentWindow(duration)
		// 获取所有主机数据
		hostMetrics, err := w.client.FetchAllHostsMetrics(curWindow)

		if err != nil {
			log.Errorf("received error while fetching metrics: %v", err)
			return
		}
		log.Debugf("fetched metrics for window: %v", curWindow)

		// TODO: add tags, etc.
		watcherMetrics := metricMapToWatcherMetrics(hostMetrics, w.client.Name(), *curWindow)
		w.appendWatcherMetrics(metric, &watcherMetrics)
	}

	windowWatcher := func(duration string) {
		for {
			fetchOnce(duration)
			// This is assuming fetching of metrics won't exceed more than 1 minute. If it happens we need to throttle rate of fetches
			time.Sleep(time.Minute)
		}
	}

	durations := [3]string{FifteenMinutes, TenMinutes, FiveMinutes}
	for _, duration := range durations {
		// Populate cache initially before returning
		fetchOnce(duration)
		go windowWatcher(duration)
	}

	// 暴露 /watcher 接口 导出数据
	http.HandleFunc(BaseUrl, w.handler)
	http.HandleFunc(HealthCheckUrl, w.healthCheckHandler)
	server := &http.Server{
		Addr:    ":2020",
		Handler: http.DefaultServeMux,
	}

	go func() {
		log.Warn(server.ListenAndServe())
	}()

	signal.Notify(w.shutdown, os.Interrupt, syscall.SIGTERM)

	go func() {
		<-w.shutdown
		ctx, cancel := context.WithTimeout(context.Background(), time.Minute)
		defer cancel()
		if err := server.Shutdown(ctx); err != nil {
			log.Errorf("Unable to shutdown server: %v", err)
		}
	}()

	w.mutex.Lock()
	w.isStarted = true
	w.mutex.Unlock()
	log.Info("Started watching metrics")
}
这里 prometheus 为例
func (s promClient) FetchAllHostsMetrics(window *watcher.Window) (map[string][]watcher.Metric, error) {
	hostMetrics := make(map[string][]watcher.Metric)
	var anyerr error

	for _, method := range []string{promAvg, promStd} { // 平均值 avg_over_time 和 标准值  stddev_over_time"
		for _, metric := range []string{promCpuMetric, promMemMetric, promTransBandMetric, promTransBandDropMetric, promRecBandMetric, promRecBandDropMetric, promDiskIOMetric} {
			promQuery := s.buildPromQuery(allHosts, metric, method, window.Duration)
			promResults, err := s.getPromResults(promQuery)

			if err != nil {
				log.Errorf("error querying Prometheus for query %v: %v\n", promQuery, err)
				anyerr = err
				continue
			}
			// 指标数据处理
			curMetricMap := s.promResults2MetricMap(promResults, metric, method, window.Duration)

			for k, v := range curMetricMap { // 构建以主机为key的map
				hostMetrics[k] = append(hostMetrics[k], v...)
			}
		}
	}

	return hostMetrics, anyerr
}
LoadVariationRiskBalancing 负载感知均衡调度
因为没有考虑到突发性的变化,基于实际平均负载的策略有时是有风险的。LoadVariationRiskBalancing插件不仅可以平衡实际平均负载,还可以降低负载突发性变化引发的风险。
LoadVariationRiskBalancing 插件的算法是利用节点负载在某段时间内(滑动窗口)的平均值(M)和标准差(V)这两个指标,
假设集群所有节点的CPU利用率的M+V是0.3(30%),那么每个节点的cpu利用率的M+V越接近0.3,得分应该越小。
LoadVariationRiskBalancing是分别计算每种资源的得分,再取得分的最小值,例:假设CPU得分2,内存得分10,则节点的最终得分是2。
// https://github.com/kubernetes-sigs/scheduler-plugins/blob/59a8b1ca68d0256d10239a588d69ab0ba28d4076/pkg/trimaran/loadvariationriskbalancing/loadvariationriskbalancing.go

// 打分
func (pl *LoadVariationRiskBalancing) Score(ctx context.Context, cycleState *framework.CycleState, pod *v1.Pod, nodeName string) (int64, *framework.Status) {
	logger := klog.FromContext(ctx)
	logger.V(6).Info("Calculating score", "pod", klog.KObj(pod), "nodeName", nodeName)
	score := framework.MinNodeScore
	nodeInfo, err := pl.handle.SnapshotSharedLister().NodeInfos().Get(nodeName)
	if err != nil {
		return score, framework.NewStatus(framework.Error, fmt.Sprintf("getting node %q from Snapshot: %v", nodeName, err))
	}
	// 获取 node 的 metrics
	metrics, _ := pl.collector.GetNodeMetrics(logger, nodeName)
	if metrics == nil {
		logger.Info("Failed to get metrics for node; using minimum score", "nodeName", nodeName)
		return score, nil
	}
	// 算法步骤:
	// 1. 获取待调度的Pod 的request的资源,设为r 。
	podRequest := trimaran.GetResourceRequested(pod)
	node := nodeInfo.Node()

	// 2. 获取当前节点所有类型的资源(CPU、Memory等)的利用率的百分比(0到1),并根据计算的滑动窗口的平均数(V)和标准差(M),进行打分。
	// 计算 CPU 分数
	var cpuScore float64 = 0
	cpuStats, cpuOK := trimaran.CreateResourceStats(logger, metrics, node, podRequest, v1.ResourceCPU, watcher.CPU)
	if cpuOK {
		// 3. 计算当前节点对各类资源的得分:Si = M + r + V
		cpuScore = computeScore(logger, cpuStats, pl.args.SafeVarianceMargin, pl.args.SafeVarianceSensitivity)
	}
	logger.V(6).Info("Calculating CPUScore", "pod", klog.KObj(pod), "nodeName", nodeName, "cpuScore", cpuScore)
	// 计算 Memory 分数
	var memoryScore float64 = 0
	memoryStats, memoryOK := trimaran.CreateResourceStats(logger, metrics, node, podRequest, v1.ResourceMemory, watcher.Memory)
	if memoryOK {
		memoryScore = computeScore(logger, memoryStats, pl.args.SafeVarianceMargin, pl.args.SafeVarianceSensitivity)
	}
	logger.V(6).Info("Calculating MemoryScore", "pod", klog.KObj(pod), "nodeName", nodeName, "memoryScore", memoryScore)

	// 计算总分
	var totalScore float64 = 0
	if memoryOK && cpuOK { // 两者存在去最小值
		totalScore = math.Min(memoryScore, cpuScore)
	} else {
		totalScore = math.Max(memoryScore, cpuScore)
	}
	score = int64(math.Round(totalScore))
	logger.V(6).Info("Calculating totalScore", "pod", klog.KObj(pod), "nodeName", nodeName, "totalScore", score)
	return score, framework.NewStatus(framework.Success, "")
}
// pkg/trimaran/resourcestats.go

// GetResourceRequested : calculate the resource requests of a pod (CPU and Memory)
func GetResourceRequested(pod *v1.Pod) *framework.Resource {
	return GetEffectiveResource(pod, func(container *v1.Container) v1.ResourceList {
		return container.Resources.Requests
	})
}
func CreateResourceStats(logger klog.Logger, metrics []watcher.Metric, node *v1.Node, podRequest *framework.Resource,
	resourceName v1.ResourceName, watcherType string) (rs *ResourceStats, isValid bool) {
	// 获取资源统计
	nodeUtil, nodeStd, metricFound := GetResourceData(metrics, watcherType)
	if !metricFound {
		logger.V(6).Info("Resource usage statistics for node : no valid data", "node", klog.KObj(node))
		return nil, false
	}
	// 获取节点的可分配资源
	rs = &ResourceStats{}
	allocatableResources := node.Status.Allocatable
	am := allocatableResources[resourceName]

	if resourceName == v1.ResourceCPU {
		rs.Capacity = float64(am.MilliValue())
		rs.Req = float64(podRequest.MilliCPU)
	} else {
		rs.Capacity = float64(am.Value())
		rs.Capacity *= MegaFactor
		rs.Req = float64(podRequest.Memory) * MegaFactor
	}

	// calculate absolute usage statistics
	rs.UsedAvg = nodeUtil * rs.Capacity / 100
	rs.UsedStdev = nodeStd * rs.Capacity / 100

	logger.V(6).Info("Resource usage statistics for node", "node", klog.KObj(node), "resource", resourceName,
		"capacity", rs.Capacity, "required", rs.Req, "usedAvg", rs.UsedAvg, "usedStdev", rs.UsedStdev)
	return rs, true
}
// 计算分数
// - risk = [ average + margin * stDev^{1/sensitivity} ] / 2
// - score = ( 1 - risk ) * maxScore
func computeScore(logger klog.Logger, rs *trimaran.ResourceStats, margin float64, sensitivity float64) float64 {
	if rs.Capacity <= 0 {
		logger.Error(nil, "Invalid resource capacity", "capacity", rs.Capacity)
		return 0
	}

	// make sure values are within bounds
	rs.Req = math.Max(rs.Req, 0)
	rs.UsedAvg = math.Max(math.Min(rs.UsedAvg, rs.Capacity), 0)
	rs.UsedStdev = math.Max(math.Min(rs.UsedStdev, rs.Capacity), 0)

	// calculate average and deviation factors
	// mu-sigma图的mu指的是均值(μ),sigma指标准差(σ)。
	mu, sigma := trimaran.GetMuSigma(rs)

	// apply root power
	if sensitivity >= 0 {
		sigma = math.Pow(sigma, 1/sensitivity) // sigma^{1/sensitivity}
	}
	// apply multiplier
	sigma *= margin   // margin*sigma^{1/sensitivity}
	sigma = math.Max(math.Min(sigma, 1), 0)

	// evaluate overall risk factor
	risk := (mu + sigma) / 2
	logger.V(6).Info("Evaluating risk factor", "mu", mu, "sigma", sigma, "margin", margin, "sensitivity", sensitivity, "risk", risk)
	return (1. - risk) * float64(framework.MaxNodeScore)
}


// GetMuSigma : get average and standard deviation from statistics
func GetMuSigma(rs *ResourceStats) (float64, float64) {
	if rs.Capacity <= 0 {
		return 0, 0
	}
	mu := (rs.UsedAvg + rs.Req) / rs.Capacity
	mu = math.Max(math.Min(mu, 1), 0)
	sigma := rs.UsedStdev / rs.Capacity
	sigma = math.Max(math.Min(sigma, 1), 0)
	return mu, sigma
}
- 获取每种类型资源的分数并将其绑定到 [0,1],意思就是最小值为0,最大值为1,小于最小值取最小值,大于最大值取最大值:Si = min(Si,1.0)
- 计算当前节点每种资源的优先级得分:Ui = (1-Si) x MaxPriority。
- 当前节点最终的得分为:U = min(Ui),意思是cpu、内存的分数,哪个低取哪个:
TargetLoadPacking 负载上限调度
TargetLoadPacking即目标负载调度器,用于控制节点的CPU利用率不超过目标值x%(例如65%),通过打分让所有cpu利用率超过x%的都不被选中。目标负载调度器只支持CPU。
使用此插件结合LoadVariationRiskBalancing插件,可以保证在负载均衡调度的基础上,保证节点不会超负载,确保服务的稳定运行。成本的优化一定是建立在稳定性之上的。
func (pl *TargetLoadPacking) Score(ctx context.Context, cycleState *framework.CycleState, pod *v1.Pod, nodeName string) (int64, *framework.Status) {
	logger := klog.FromContext(ctx)
	score := framework.MinNodeScore
	nodeInfo, err := pl.handle.SnapshotSharedLister().NodeInfos().Get(nodeName)
	if err != nil {
		return score, framework.NewStatus(framework.Error, fmt.Sprintf("getting node %q from Snapshot: %v", nodeName, err))
	}

	// 获取节点 metrics
	metrics, allMetrics := pl.collector.GetNodeMetrics(logger, nodeName)
    // ...

	// 计算 pod 使用率
	var curPodCPUUsage int64
	for _, container := range pod.Spec.Containers {
		// Pod cpu使用量是优先通过limit取得,不存在才通过request获取,在公司内limit和Pod实际使用率偏差较大
		curPodCPUUsage += PredictUtilisation(&container)
	}
	logger.V(6).Info("Predicted utilization for pod", "podName", pod.Name, "cpuUsage", curPodCPUUsage)
	// 补充runtimeClass 定义的 overhead
	if pod.Spec.Overhead != nil {
		curPodCPUUsage += pod.Spec.Overhead.Cpu().MilliValue()
	}
	// 计算当前节点的 cpu 使用率
	var nodeCPUUtilPercent float64
	var cpuMetricFound bool
	for _, metric := range metrics {
		if metric.Type == watcher.CPU {
			if metric.Operator == watcher.Average || metric.Operator == watcher.Latest {
				nodeCPUUtilPercent = metric.Value
				cpuMetricFound = true
			}
		}
	}

	if !cpuMetricFound {
		logger.Error(nil, "Cpu metric not found in node metrics", "nodeName", nodeName, "nodeMetrics", metrics)
		return score, nil
	}
	nodeCPUCapMillis := float64(nodeInfo.Node().Status.Capacity.Cpu().MilliValue())
	nodeCPUUtilMillis := (nodeCPUUtilPercent / 100) * nodeCPUCapMillis

	logger.V(6).Info("Calculating CPU utilization and capacity", "nodeName", nodeName, "cpuUtilMillis", nodeCPUUtilMillis, "cpuCapMillis", nodeCPUCapMillis)

	var missingCPUUtilMillis int64 = 0
	pl.eventHandler.RLock()
	for _, info := range pl.eventHandler.ScheduledPodsCache[nodeName] {
		// If the time stamp of the scheduled pod is outside fetched metrics window, or it is within metrics reporting interval seconds, we predict util.
		// Note that the second condition doesn't guarantee metrics for that pod are not reported yet as the 0 <= t <= 2*metricsAgentReportingIntervalSeconds
		// t = metricsAgentReportingIntervalSeconds is taken as average case and it doesn't hurt us much if we are
		// counting metrics twice in case actual t is less than metricsAgentReportingIntervalSeconds
		if info.Timestamp.Unix() > allMetrics.Window.End || info.Timestamp.Unix() <= allMetrics.Window.End &&
			(allMetrics.Window.End-info.Timestamp.Unix()) < metricsAgentReportingIntervalSeconds {
			for _, container := range info.Pod.Spec.Containers {
				missingCPUUtilMillis += PredictUtilisation(&container)
			}
			missingCPUUtilMillis += info.Pod.Spec.Overhead.Cpu().MilliValue()
			logger.V(6).Info("Missing utilization for pod", "podName", info.Pod.Name, "missingCPUUtilMillis", missingCPUUtilMillis)
		}
	}
	pl.eventHandler.RUnlock()
	logger.V(6).Info("Missing utilization for node", "nodeName", nodeName, "missingCPUUtilMillis", missingCPUUtilMillis)

	var predictedCPUUsage float64
	if nodeCPUCapMillis != 0 {
		// 如果 Pod 调度在该节点下,计算预期利用率,即 target_cpu = node_cpu + pod_cpu
		predictedCPUUsage = 100 * (nodeCPUUtilMillis + float64(curPodCPUUsage) + float64(missingCPUUtilMillis)) / nodeCPUCapMillis
	}
	if predictedCPUUsage > float64(hostTargetUtilizationPercent) {
		if predictedCPUUsage > 100 {
			// 超过100%,直接返回 MinNodeScore 0
			return score, framework.NewStatus(framework.Success, "")
		}
		penalisedScore := int64(math.Round(float64(hostTargetUtilizationPercent) * (100 - predictedCPUUsage) / (100 - float64(hostTargetUtilizationPercent))))
		logger.V(6).Info("Penalised score for host", "nodeName", nodeName, "penalisedScore", penalisedScore)
		return penalisedScore, framework.NewStatus(framework.Success, "")
	}

	score = int64(math.Round((100-float64(hostTargetUtilizationPercent))*
		predictedCPUUsage/float64(hostTargetUtilizationPercent) + float64(hostTargetUtilizationPercent)))
	logger.V(6).Info("Score for host", "nodeName", nodeName, "score", score)
	return score, framework.NewStatus(framework.Success, "")
}
func PredictUtilisation(container *v1.Container) int64 {
	if _, ok := container.Resources.Limits[v1.ResourceCPU]; ok {
		return container.Resources.Limits.Cpu().MilliValue()
	} else if _, ok := container.Resources.Requests[v1.ResourceCPU]; ok {
		return int64(math.Round(float64(container.Resources.Requests.Cpu().MilliValue()) * requestsMultiplier))
	}
	return requestsMilliCores
}
计算公式
cluster_cpu = 预设理想值
target_cpu = node_cpu + pod_cpu
if target_cpu <= cluster_cpu:
  score = (100 - cluster_cpu)target_cpu/cluster_cpu+ cluster_cpu
else if cluster_cpu < target_cpu <= 100:
  score = cluster_cpu(100 - target_cpu)/(100 - cluster_cpu)
else:
  score = 0
LowRiskOverCommitment 资源限制感知调度
让limits也能均衡分布,通过跨节点“分散”或“平衡”Pod 的资源limits来缓解可突发Pod导致的资源过度订阅问题。
// computeRank : rank function for the LowRiskOverCommitment
func (pl *LowRiskOverCommitment) computeRank(logger klog.Logger, metrics []watcher.Metric, nodeInfo *framework.NodeInfo, pod *v1.Pod,
	podRequests *framework.Resource, podLimits *framework.Resource) float64 {
	node := nodeInfo.Node()
	// calculate risk based on requests and limits
	nodeRequestsAndLimits := trimaran.GetNodeRequestsAndLimits(logger, nodeInfo.Pods, node, pod, podRequests, podLimits)
	riskCPU := pl.computeRisk(logger, metrics, v1.ResourceCPU, watcher.CPU, node, nodeRequestsAndLimits)
	riskMemory := pl.computeRisk(logger, metrics, v1.ResourceMemory, watcher.Memory, node, nodeRequestsAndLimits)
	rank := 1 - math.Max(riskCPU, riskMemory)

	logger.V(6).Info("Node rank", "nodeName", node.GetName(), "riskCPU", riskCPU, "riskMemory", riskMemory, "rank", rank)

	return rank
}


func (pl *LowRiskOverCommitment) computeRisk(logger klog.Logger, metrics []watcher.Metric, resourceName v1.ResourceName,
	resourceType string, node *v1.Node, nodeRequestsAndLimits *trimaran.NodeRequestsAndLimits) float64 {
	var riskLimit, riskLoad, totalRisk float64

	defer func() {
		logger.V(6).Info("Calculated risk", "node", klog.KObj(node), "resource", resourceName,
			"riskLimit", riskLimit, "riskLoad", riskLoad, "totalRisk", totalRisk)
	}()

	nodeRequest := nodeRequestsAndLimits.NodeRequest
	nodeLimit := nodeRequestsAndLimits.NodeLimit
	nodeRequestMinusPod := nodeRequestsAndLimits.NodeRequestMinusPod
	nodeLimitMinusPod := nodeRequestsAndLimits.NodeLimitMinusPod
	nodeCapacity := nodeRequestsAndLimits.Nodecapacity

	var request, limit, capacity, requestMinusPod, limitMinusPod int64
	if resourceName == v1.ResourceCPU {
		request = nodeRequest.MilliCPU
		limit = nodeLimit.MilliCPU
		requestMinusPod = nodeRequestMinusPod.MilliCPU
		limitMinusPod = nodeLimitMinusPod.MilliCPU
		capacity = nodeCapacity.MilliCPU
	} else if resourceName == v1.ResourceMemory {
		request = nodeRequest.Memory
		limit = nodeLimit.Memory
		requestMinusPod = nodeRequestMinusPod.Memory
		limitMinusPod = nodeLimitMinusPod.Memory
		capacity = nodeCapacity.Memory
	} else {
		// invalid resource
		logger.V(6).Info("Unexpected resource", "resourceName", resourceName)
		return 0
	}

	// (1) riskLimit : calculate overcommit potential load
	if limit > capacity {
		riskLimit = float64(limit-capacity) / float64(limit-request)
	}
	logger.V(6).Info("RiskLimit", "node", klog.KObj(node), "resource", resourceName, "riskLimit", riskLimit)

	// (2) riskLoad : calculate measured overcommitment
	zeroRequest := &framework.Resource{}
	stats, ok := trimaran.CreateResourceStats(logger, metrics, node, zeroRequest, resourceName, resourceType)
	if ok {
		// fit a beta distribution to the measured load stats
		mu, sigma := trimaran.GetMuSigma(stats)
		// adjust standard deviation due to data smoothing
		// 求出x 的y 次方
		sigma *= math.Pow(float64(pl.args.SmoothingWindowSize), 0.5)
		// limit the standard deviation close to the allowed maximum for the beta distribution
		// math.Sqrt 一个数的平方根
		sigma = math.Min(sigma, math.Sqrt(GetMaxVariance(mu)*MaxVarianceAllowance))

		// calculate area under beta probability curve beyond total allocated, as overuse risk measure
		allocThreshold := float64(requestMinusPod) / float64(capacity)
		allocThreshold = math.Min(math.Max(allocThreshold, 0), 1)
		allocProb, fitDistribution := ComputeProbability(mu, sigma, allocThreshold)
		if fitDistribution != nil {
			klog.V(6).InfoS("FitDistribution", "node", klog.KObj(node), "resource", resourceName, "dist", fitDistribution.Print())
		}
		// condition the probability in case total limit is less than capacity
		if limitMinusPod < capacity && requestMinusPod <= limitMinusPod {
			limitThreshold := float64(limitMinusPod) / float64(capacity)
			if limitThreshold == 0 {
				allocProb = 1 // zero over zero
			} else if fitDistribution != nil {
				limitProb := fitDistribution.DistributionFunction(limitThreshold)
				if limitProb > 0 {
					allocProb /= limitProb
					allocProb = math.Min(math.Max(allocProb, 0), 1)
				}
			}
		}

		// calculate risk
		riskLoad = 1 - allocProb
		logger.V(6).Info("RiskLoad", "node", klog.KObj(node), "resource", resourceName,
			"allocThreshold", allocThreshold, "allocProb", allocProb, "riskLoad", riskLoad)
	}

	// combine two components of risk into a total risk as a weighted sum
	w := pl.riskLimitWeightsMap[resourceName]
	totalRisk = w*riskLimit + (1-w)*riskLoad
	totalRisk = math.Min(math.Max(totalRisk, 0), 1)
	return totalRisk
}